


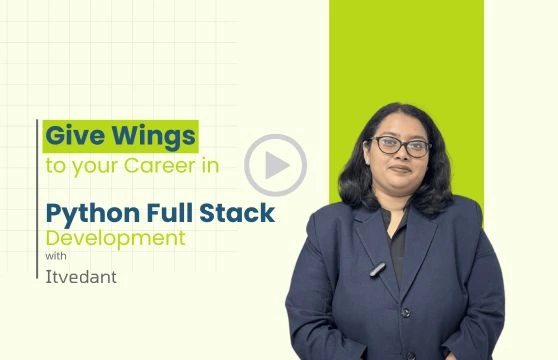
A Career-Focused Python Full Stack Development Course Built to Make You Industry-Ready
In association with :


5
4
3
2
1
6,584 reviews
Sort by
5
4
3
2
1
6,584 reviews
Sort by

Duration:
 Duration : 8-10 Month
Mode of Training:
 Classroom & Online

Bridge the gap between formal education and practical skills, empowering you for your dream job
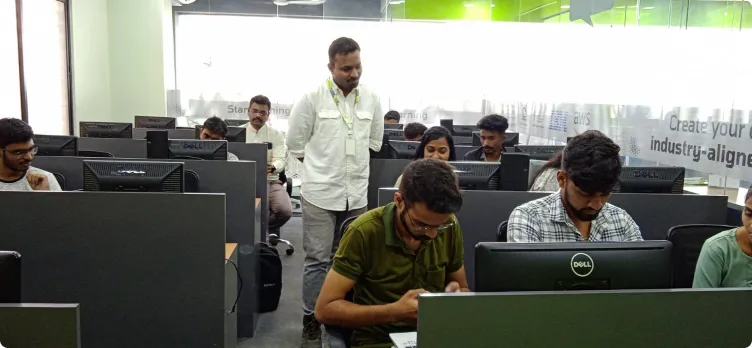
80% Practical Training
Get Trained From Industry Experts
Instant Doubt Solving Session
Integrated Internship
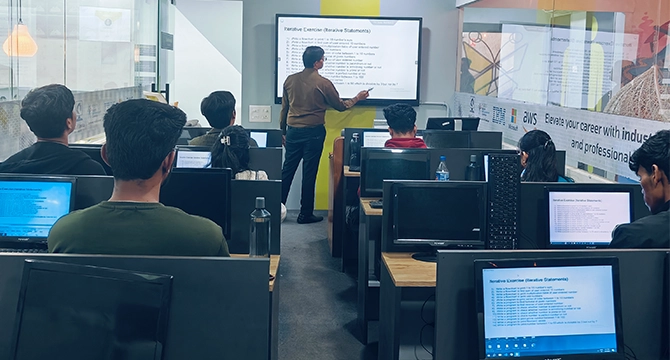
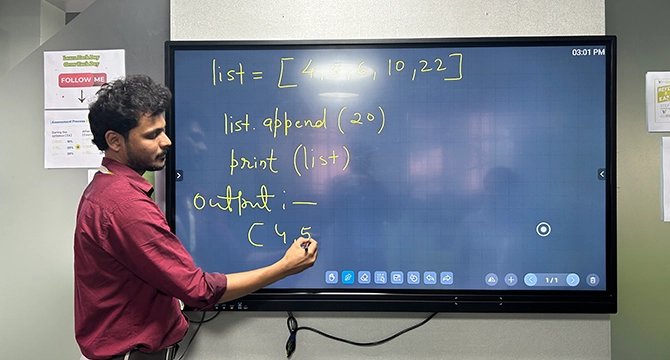
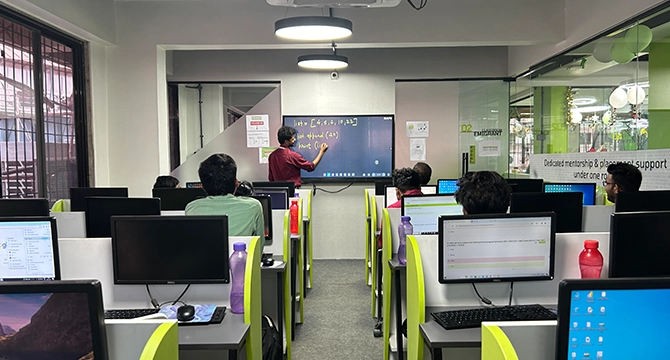
Explore each topic in-depth through interactive sessions, real-world use cases, and tool-based learning. You’ll not only understand the theory but also build practical skills that matter in actual roles.
Case Studies & Projects
Languages & Tools
Live Sessions Hours
Work on real-world data projects across HR, Sales, Logistics, health, BFSI, E-Commerce, and more. Build a portfolio that proves your skills.
Build an elegant and structured informational website with a clean, Wikipedia-like interface.
Create a seamless currency conversion web app with real-time exchange rate updates.
Design a visually appealing Anime OTT platform UI using Bootstrap for a modern user experience.
Develop a task management app similar to a to-do list, helping users stay organized efficiently.
An end-to-end case study covering database design, advanced SQL queries, and analytics for cab services.
A fun and interactive console-based MCQ quiz game designed using Python.
Develop a console-based banking application using OOP concepts for account management and transactions using Python
Create a full-stack eCommerce platform for pet products and services using Django.
A CRUD-based web app for storing, managing, and sharing food recipes dynamically.
An end-to-end database case study covering order management, customer tracking, and restaurant insights.
Design and analyze a complete movie database, implementing advanced SQL operations and queries.
Develop an end-to-end database system for banking operations, covering transactions and account management using Python
A React-based stock media website for organizing and sharing high-quality images.
A CRUD-based jewellery management platform to track inventory, sales, and purchases using Django.
Integrate ChatGPT API to create an interactive and intelligent chatbot for instant conversations.
A fun and engaging console-based word guessing game built with Python.
Every Feature Empowers the Career You’ve Always Wanted


Itvedant’s Python Full Stack Development course is known for its industry-relevant training, led by expert mentors and powered by real tools. Our learners build strong foundations by working hands-on with the very platforms used in modern data teams.
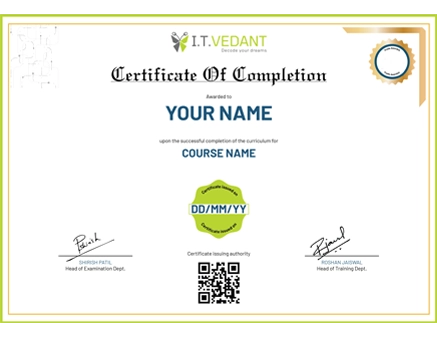
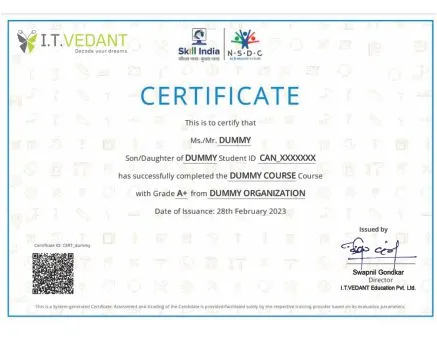
 Itvedant Certification
Itvedant
Itvedant Certification
Itvedant
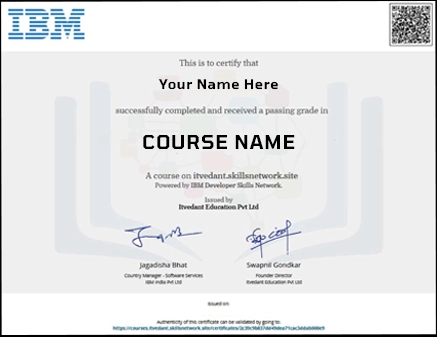
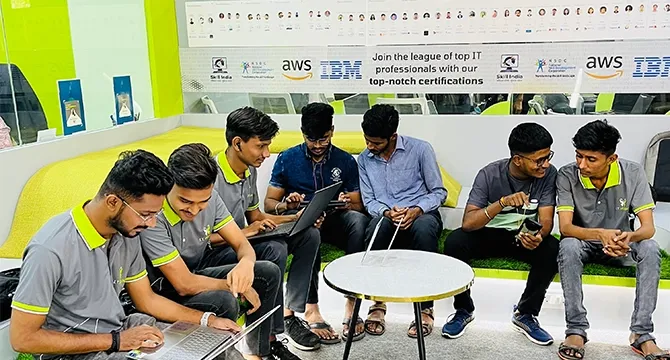
 IBM Certification
IBM
IBM Certification
IBM
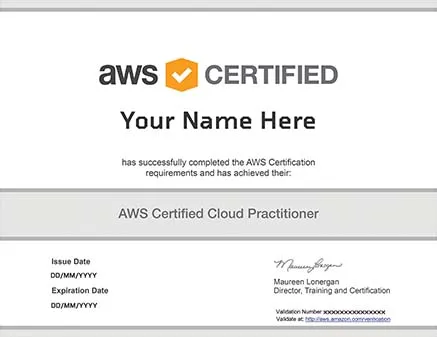
 AWS Certified Cloud Practitioner
Cloud Practitioner
AWS Certified Cloud Practitioner
Cloud Practitioner
 NSDC Certification
NSDC
NSDC Certification
NSDC
The Master Certification in Python Full-Stack Web Development Course prepares you for the heavyweight title- Python Full Stack Developer. Not just that, along with the Master Certification in Python Full Stack Developer Course you shall be given a 9-course module completion certificate at every check-point clearance if you are effective in meeting the Itvedant® Assessment Standards.
The Curriculum of the Masters in Python Full Stack Developer Course is made up of three modules- Python for Web Developers, Web Development using HTML python Fundamentals that will teach you the most enhanced job-ready technologies and skills, such as open source tools and libraries, Python, Databases, SQL, Data Visualization, Data Analysis, Statistical Analysis, Predictive Modelling, etc. You’ll learn Python Full Stack Development by doing it on the IBM Cloud with actual tools and real-world data sets. After completing these courses, you will have a portfolio ready with Python Full Stack projects that will give you the confidence to pursue an interesting career in Python Full Stack Development.
In this Python Full Stack Development Course, Itvedant prepares you to help organizations identify and develop talent with critical knowledge about implementing cloud initiatives. Becoming an AWS Certified Cloud Practitioner validates cloud fluency and foundational AWS knowledge.
The NSDC (National Skill Development Corporation) certificate holds significant value in today's competitive job market and skill development landscape. It serves as a recognized validation of an individual's proficiency along with your Master Certification in Python Full Stack Developer course. Obtaining an NSDC certificate demonstrates a commitment to continuous learning and skills enhancement. Beyond its utility in the job market, an NSDC certificate is a testament to an individual's dedication to personal growth and development, promoting a sense of accomplishment and self-confidence.

Our structured learning model focuses on Attendance, Assignment & Assessment, encouraging consistency and helping you achieve a success score.
Start with

Gain hands-on expertise with tools and technologies tailored to high-demand roles in data, development, cloud, testing and marketing.

Get expert guidance on resume creation, LinkedIn, and web portfolio development to confidently present your skills to employers.

Clear the final evaluation exam designed to test your technical understanding and practical readiness to conquer real-world challenges.
Earn globally recognized certifications that validate your expertise and enhance your professional credibility across industries.

Apply your knowledge in real projects and case studies through an internship that prepares you to understand workplace challenges and build credibility.
Happy Ending

Our structured learning model focuses on Attendance, Assignment & Assessment,encouraging consistency and helping you achieve a success score.

Gain hands-on expertise with tools and technologies tailored to high-demand roles in data, development, cloud, testing and marketing.

Get expert guidance on resume creation, LinkedIn, and web portfolio development to confidently present your skills to employers.

Clear the final evaluation exam designed to test your technical understanding and practical readiness to conquer real-world challenges.
Earn globally recognized certifications that validate your expertise and enhance your professional credibility across industries.

Apply your knowledge in real projects and case studies through an internship that prepares you to understand workplace challenges and build credibility.

Ex - ![]()

Ex - ![]()

Sr. Data Scientist![]()
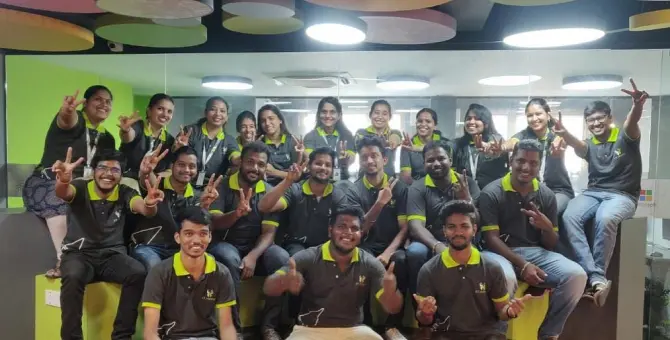
Alumni

 Enroll for 1 Course & Get Access to All Courses.
 In-depth curriculum with only 20 Seats Per Batch.
 Integrated Internship & 2 Global Certifications
 Practice on HackerRank & LeetCode
  Corporate Visits & dedicated 6-month On-Job Support.
Upcoming Batch Starts In
00
01
02
03
04
05
06
07
08
09
10
11
12
13
14
15
16
17
18
19
20
21
22
23
24
25
26
27
28
29
30
31
32
33
34
35
36
37
38
39
40
41
42
43
44
45
46
47
48
49
50
51
52
53
54
55
56
57
58
59
60
61
62
63
64
65
66
67
68
69
70
71
72
73
74
75
76
77
78
79
80
81
82
83
84
85
86
87
88
89
90
91
92
93
94
95
96
97
98
99
100
hrs
00
01
02
03
04
05
06
07
08
09
10
11
12
13
14
15
16
17
18
19
20
21
22
23
24
25
26
27
28
29
30
31
32
33
34
35
36
37
38
39
40
41
42
43
44
45
46
47
48
49
50
51
52
53
54
55
56
57
58
59
mins
00
01
02
03
04
05
06
07
08
09
10
11
12
13
14
15
16
17
18
19
20
21
22
23
24
25
26
27
28
29
30
31
32
33
34
35
36
37
38
39
40
41
42
43
44
45
46
47
48
49
50
51
52
53
54
55
56
57
58
59
sec
Hurry only 3 seats left

Yashwardhan Sir is a certified trainer, having more than 7+ years of experience in Core & Advance Java

Darshan Sir is a certified trainer, having more than 10+ years of experience in the field of AWS

Prem Sir is a certified trainer, having more than 10+ years of experience in the field of Python, ML & R programming

Punit Sir is a certified trainer, having more than 10+ years of experience in the field of Web Development
Karuna Ma’am is a certified trainer, having more than 5+ years of experience in the field of web development
Mr. Yashwardhan Singh
Mr. Darshan Rava
Mr. Prem Jejurkar
Mr. Punit Kanojia
Ms. Karuna Seby


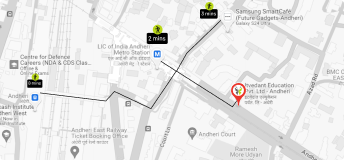
2Nfinity Drive
Andheri Branch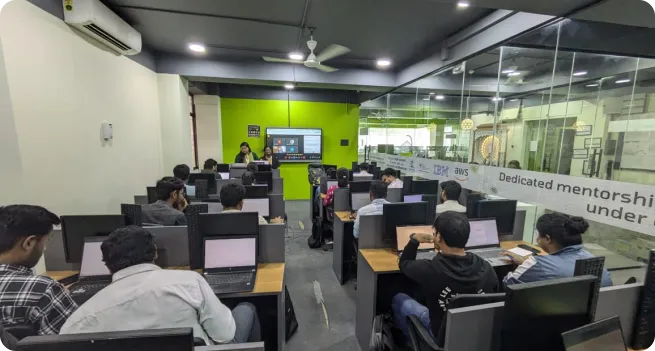
Axio Virtual Drive
Bangalore Branch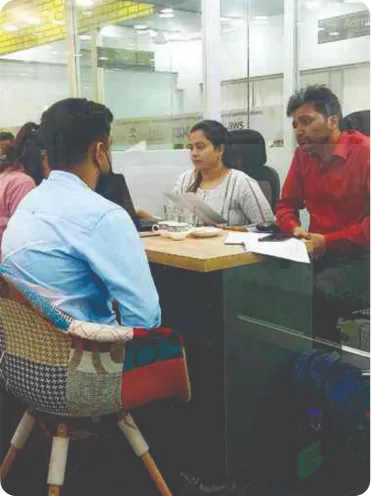
Godrej Infotech Drive
Andheri Branch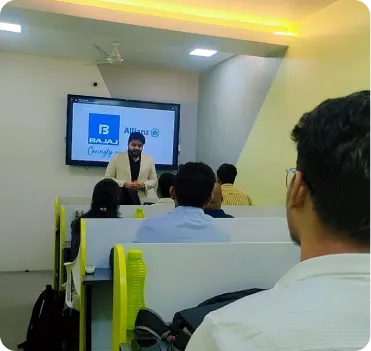
Bajaj Alliance Drive
Delhi Branch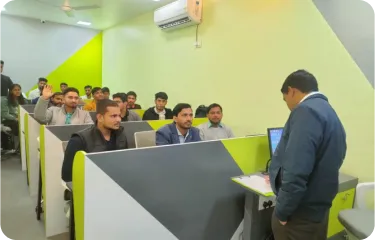
Pre-Placement Pep Talk
Delhi Branch
Amity Software Drive
Delhi Branch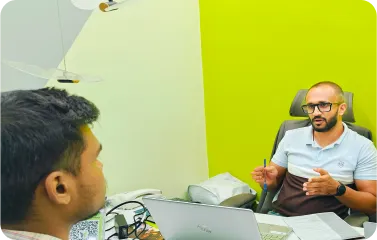
Ahy Consulting Drive
Thane Branch
Aroha Technologies
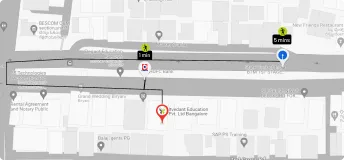
Bangalore Branch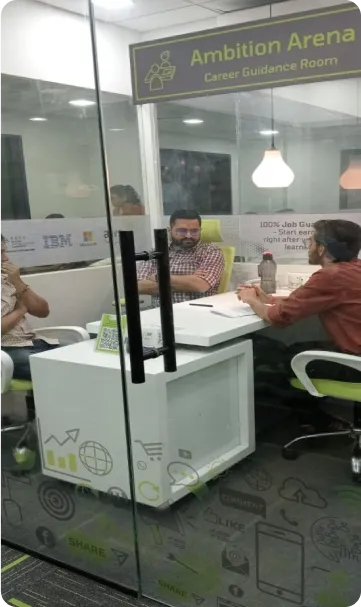
3Minds Digital Drive
Thane BranchAddress:
2nd Floor, Ishaan Arcade-1, Opposite Gaondevi Mandir, Above Canara bank, Gokhale Road,Landmark: 3 Buildings after McDonalds, Thane(West) 400602

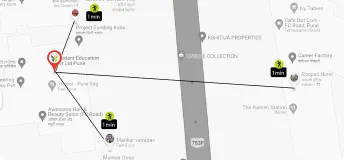
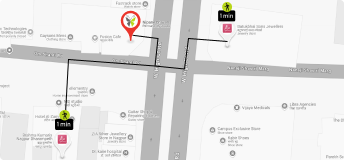
 Get Directions
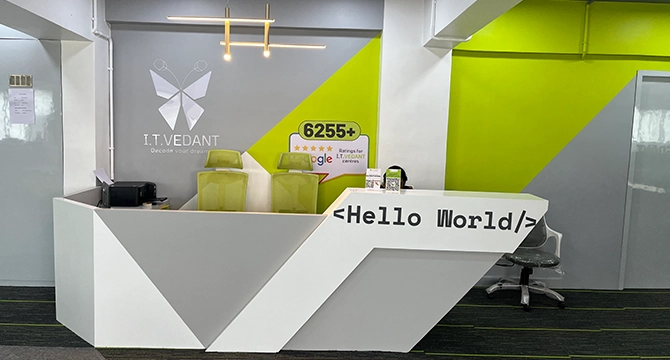
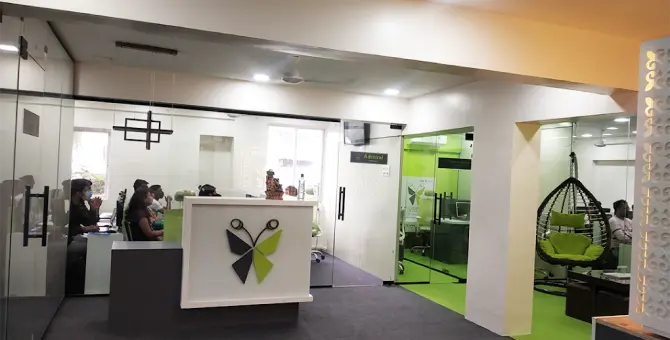
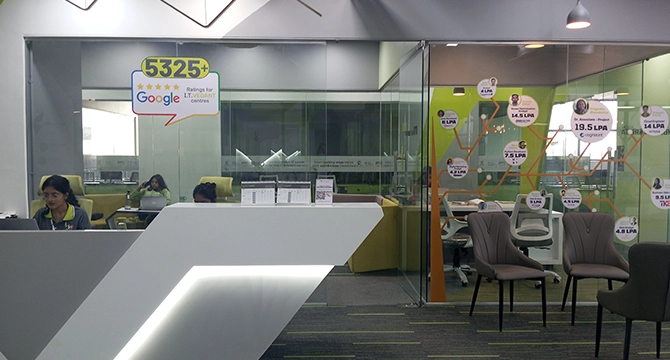
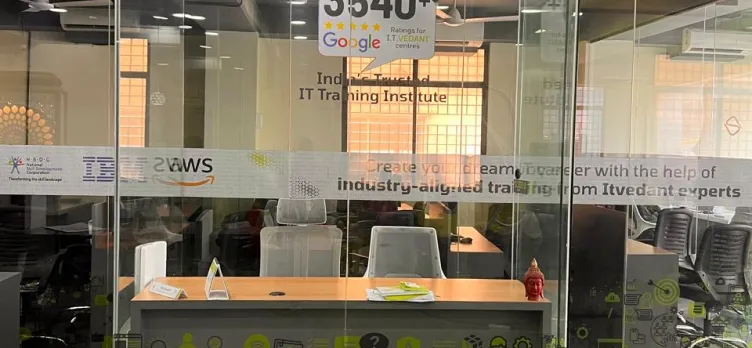
Reception Desk At Thane Branch
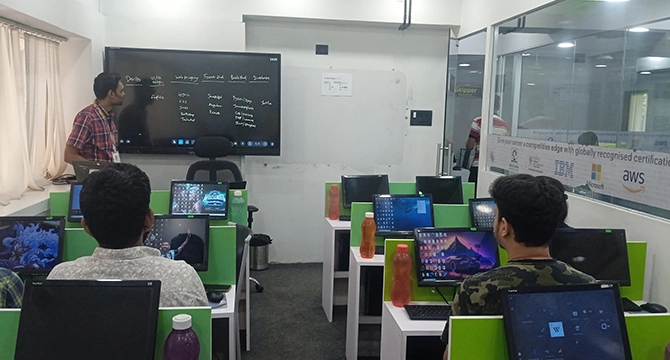
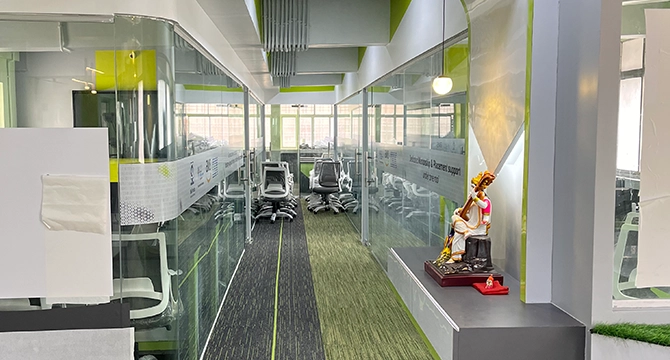
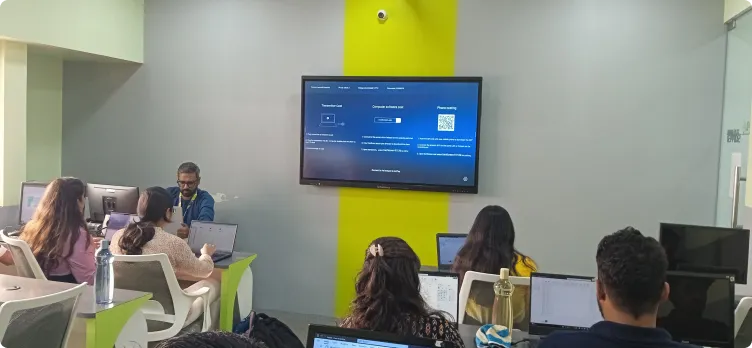
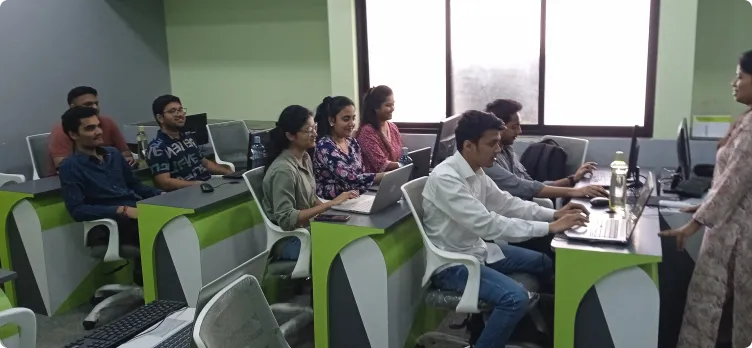
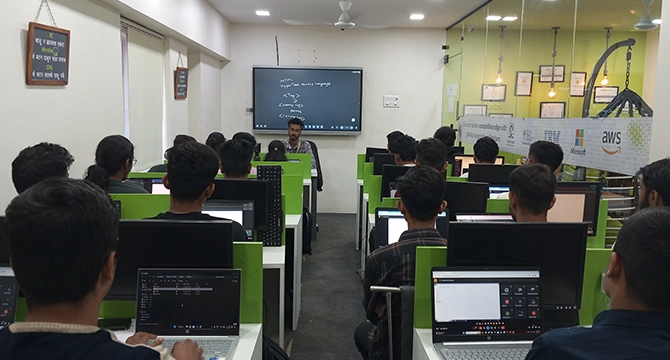
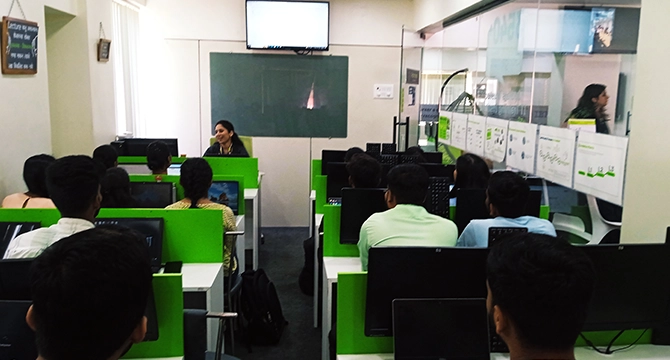
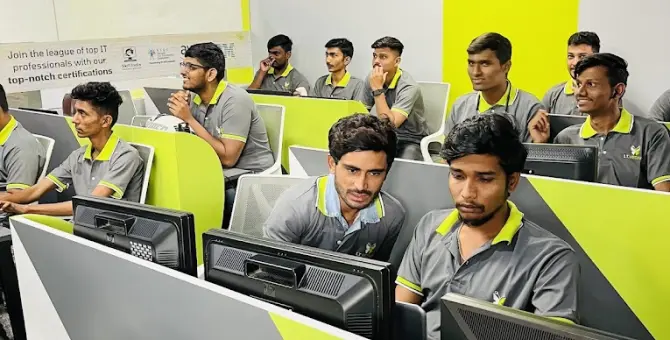
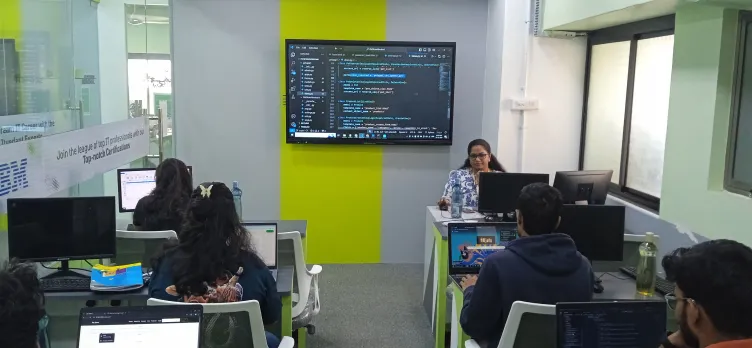
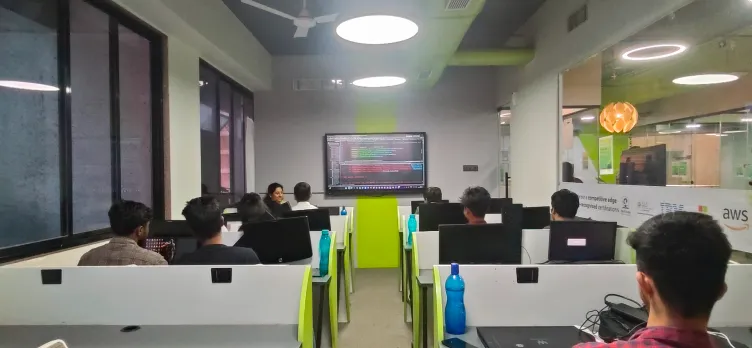
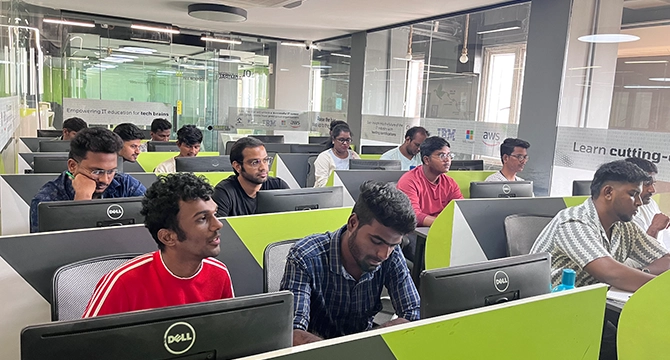
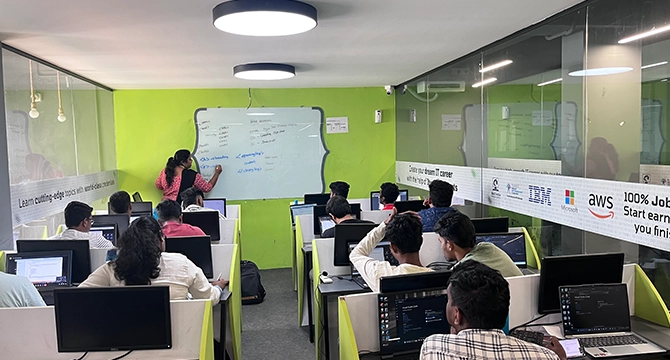
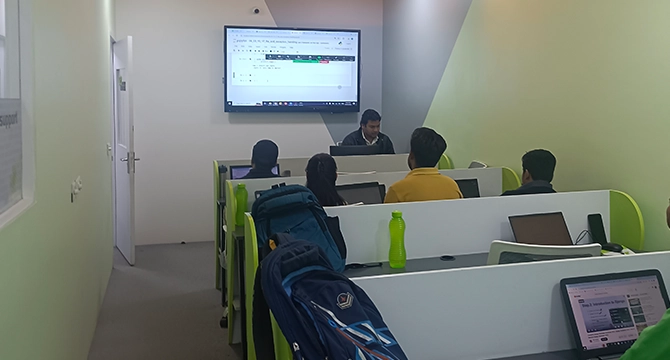
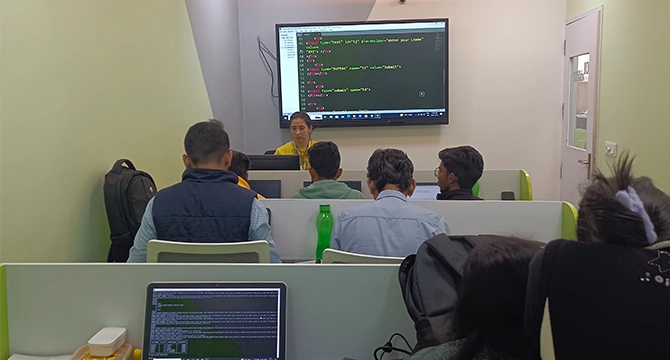
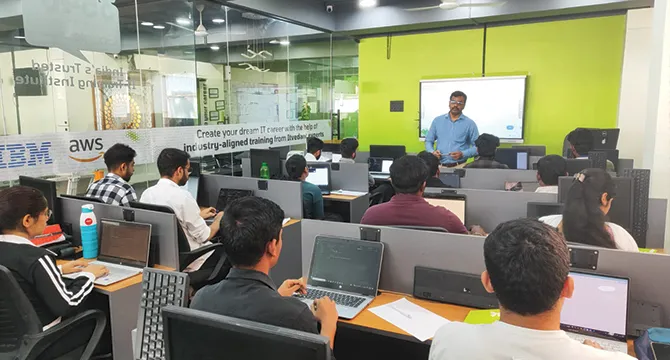
Classroom Training At Thane Branch
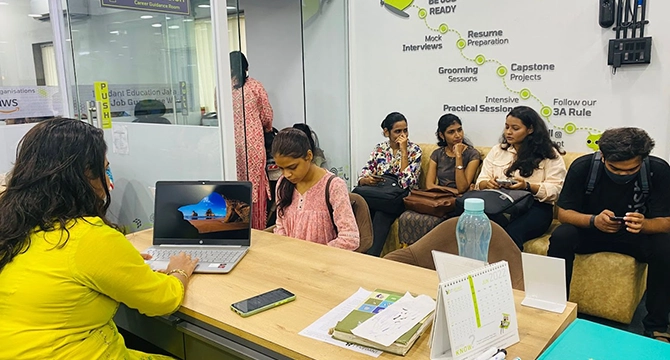
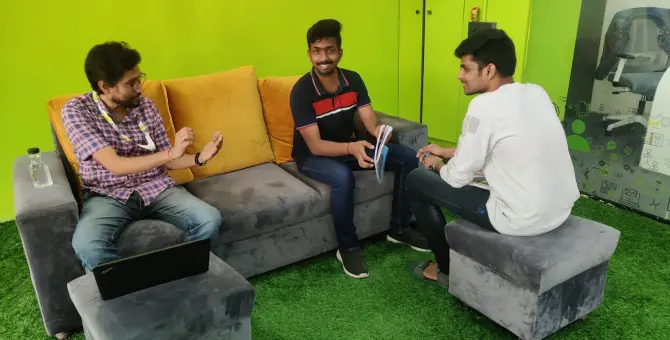
Career Guide Cabin At Thane Branch

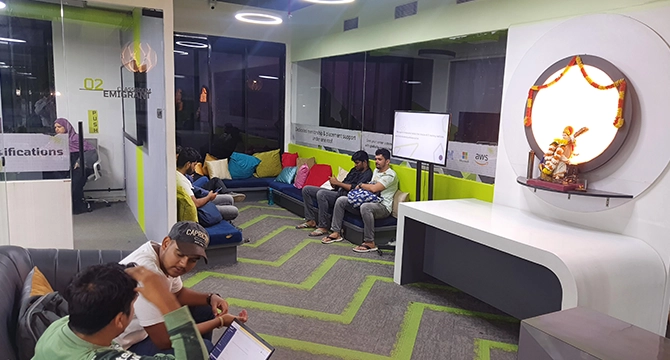
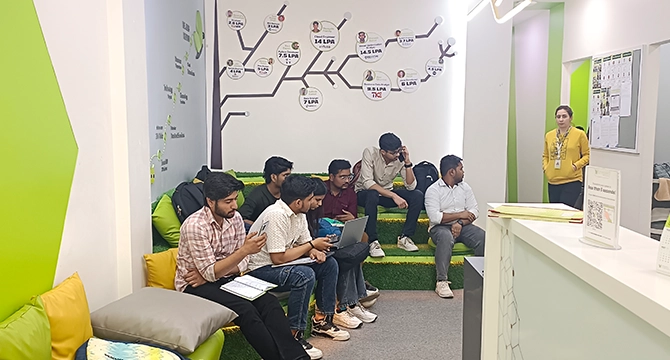
Sit Out Area At Thane Branch
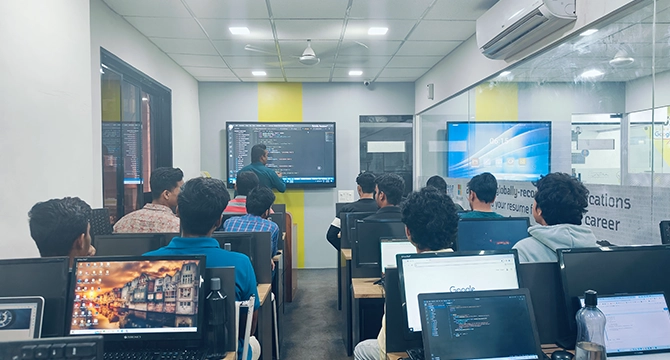
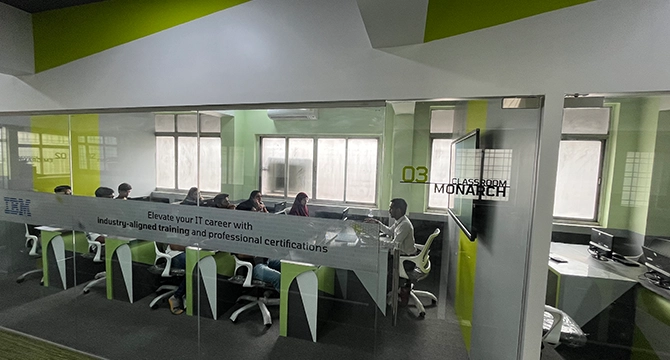
Classroom Training At Thane Branch
Address:
1st Floor Bina Apartments,Beside Ganpati Mandir,Opposite Arasa Hotel, Near Andheri Metro Station, Andheri (East), Mumbai 400069
 Get Directions
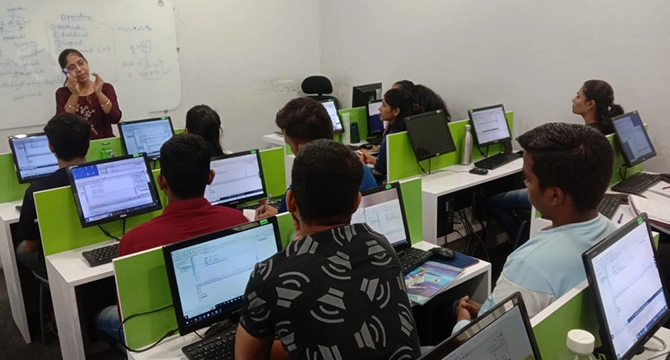
Classroom Training At Andheri Branch
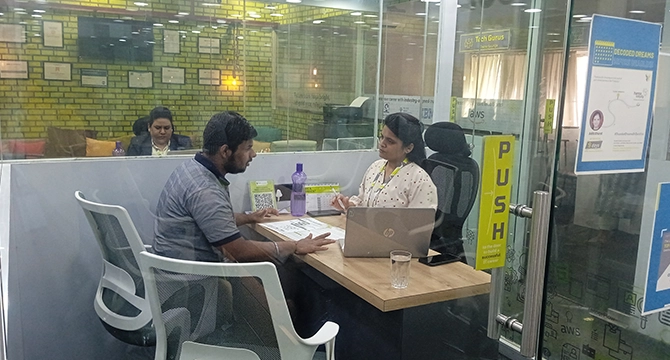
Career Guide Cabin At Andheri Branch
Classroom Training At Andheri Branch
Reception Desk At Andheri Branch
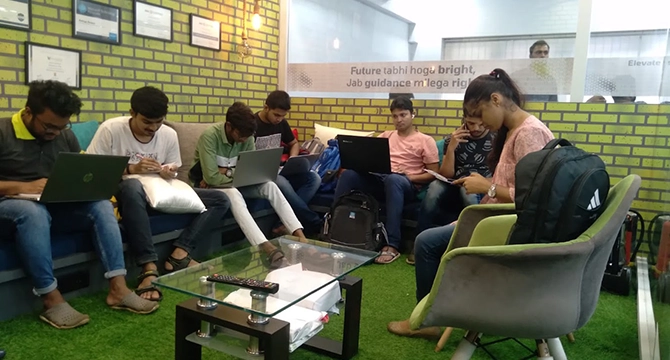
Sit Out area at Andheri branch
Address:
1st Floor, Bhandarkar Bhavan, S.V. Road Court Lanes, Near Police Station, Opp. Borivali Railway Station, Borivali West, Mumbai, Maharashtra 400092
 Get Directions
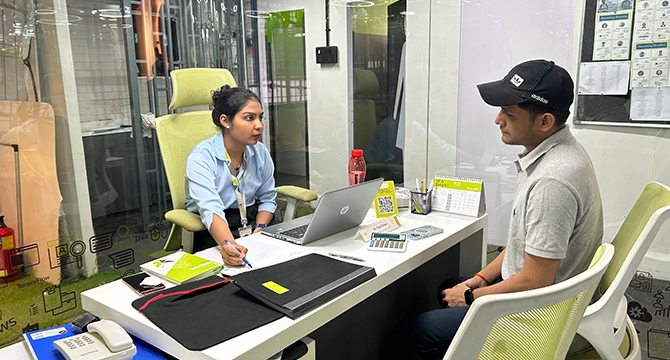
Career Guide Cabin At Borivali Branch
Classroom Training At Borivali Branch
Sit Out Area At Borivali Branch
Reception Desk At Borivali Branch
Classroom Training At Borivali Branch
Address:
3rd Floor, Abha Building,Valipeer Road, Above Kotak Bank ATM,Opp. Kalyan Railway Station Reservation Counter,Bhanunagar, Bhoiwada,Kalyan - West, Maharashtra 421301
 Get Directions
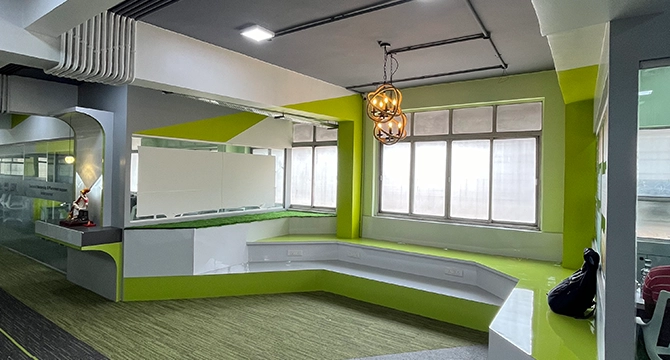
Sit Out Area At Kalyan Branch
Career Guide Cabin At Kalyan Branch
Reception Desk At Kalyan Branch
Classroom Training At Kalyan Branch
Classroom Training At Kalyan Branch
Address:
502, 5th Floor Sunshine Plaza,MMGS Marg Gautam nagar, Dadar East,Mumbai, Maharashtra 400014.
 Get Directions
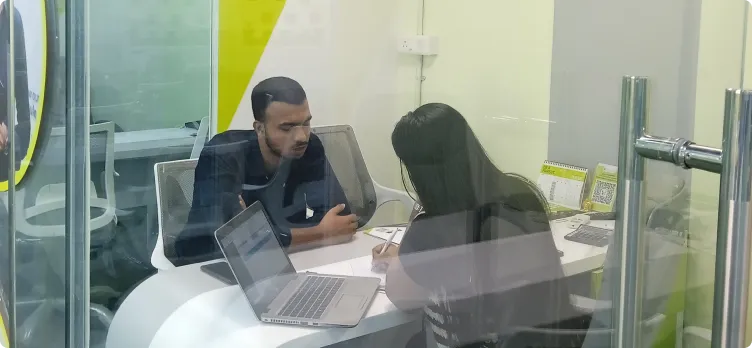
Career Guide Cabin At Dadar Branch

Career Guide Cabin At Dadar Branch
Classroom Training At Dadar Branch
Classroom Training At Dadar Branch
Classroom Training At Dadar Branch
Address:
8th Floor, Real Tech Park, 39/2, Bhagwan Mahaveer Rd, Sector 30A, Vashi, Navi Mumbai, Maharashtra 400703
 Get Directions
Reception Desk At Vashi Branch
Sit-Out Area At Vashi Branch
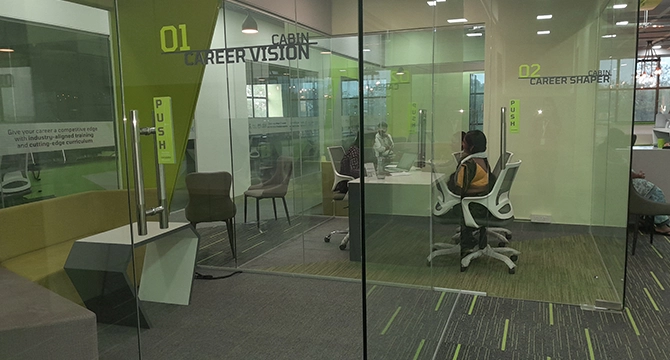
Career Guide Cabin At Vashi Branch
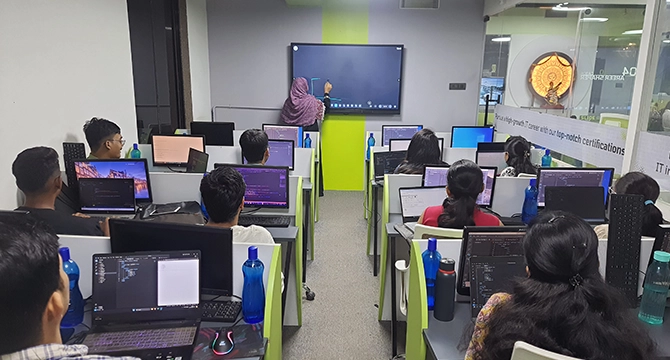
Classroom Training At Vashi Branch
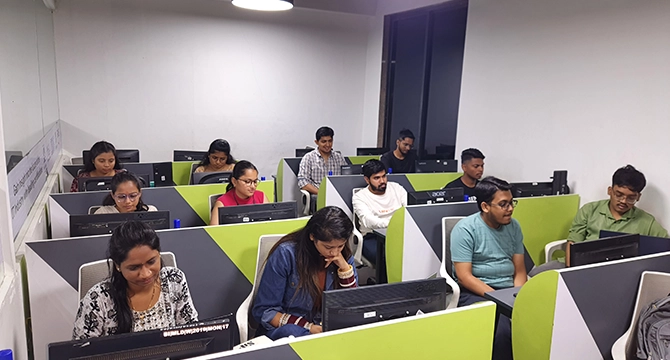
Classroom Training At Vashi Branch
Address:
2nd Floor, Sai complex, Office No. 3, F.C Road, Opp. Roopali Hotel, Pune, Maharashtra, 411004
 Get Directions
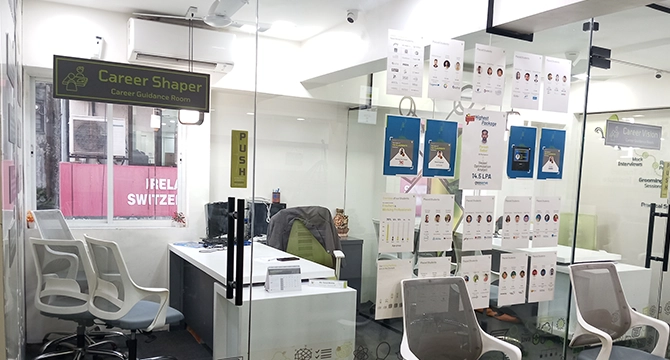
Career Guide Cabin At Pune Branch
Reception Desk At Pune Branch
Classroom Training At Pune Branch
Classroom Training At Pune Branch
Sit-Out Area At Pune Branch
Address:
22-B, 1st Floor, Rainbow Plaza,Above Axis Bank, Kokane Chowk,Wakad-Nashik Phata BRTS Road, Pimpri-Chinchwad,Rahatani, Pune 411 027
 Get Directions
Sit-Out Area At Pimpri Branch

Classroom Training At Pimpri Branch
Career Guide Cabin At Pimpri Branch
Classroom training at Pimpri-Chinchwad
Reception Desk At Pimpri Branch
Address:
2nd Floor - Bhagirathi Square Building,Katraj Chowk, Above Reliance Digital & Jeevandhara Hospital, PUNE - 411046
 Get Directions
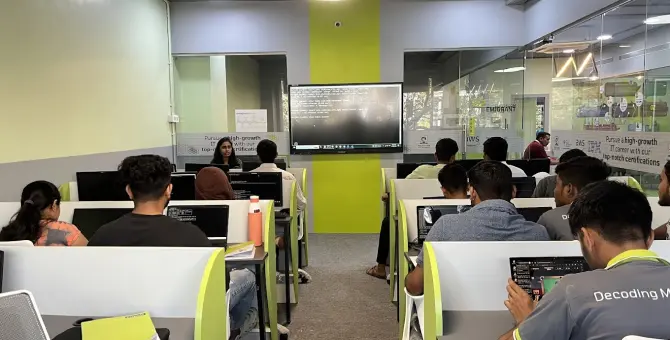
Classroom Training At Katraj Branch
Reception Desk At Katraj Branch
Sit Out Area At Katraj Branch
Classroom Training At Katraj Branch
Career Guide Cabin At Katraj Branch
Address:
2nd floor, Nipane Bhavan, Opp. Batukbhai Sons Jewellers, West High Court Road, Dharampeth, Nagpur , Maharshtra 440 010
 Get Directions
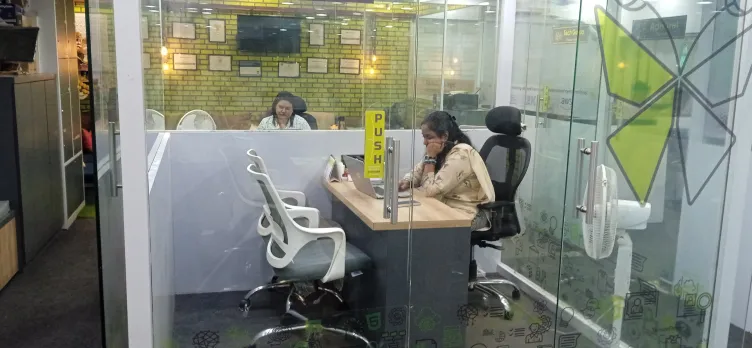
Career Guide Cabin At Nagpur Branch
Classroom Training At Nagpur Branch
Classroom Training At Nagpur Branch
Reception Desk At Nagpur Branch

Sit-Out Area At Nagpur Branch
Address:
1st Floor, Office No: 205, 206, Cuboid Business Centre, College Rd, near HPT College, above Durga Cafe, Krishi Nagar, Nashik, Maharashtra 422005
 Get Directions
Training Area At Nashik Branch

Classroom At Nashik Branch

Reception Area At Nashik Branch
Classroom Training At Nashik Branch
Interaction Session At Nashik Branch
Address:
No.8, 2nd Floor, Outer Ring Road, 1st Phase, BTM Layout 2nd Stage, Bengaluru, Karnataka 560076
 Get Directions
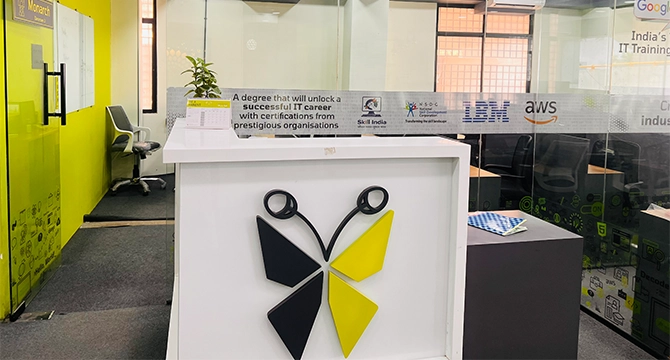
Reception Desk At Bangalore Branch
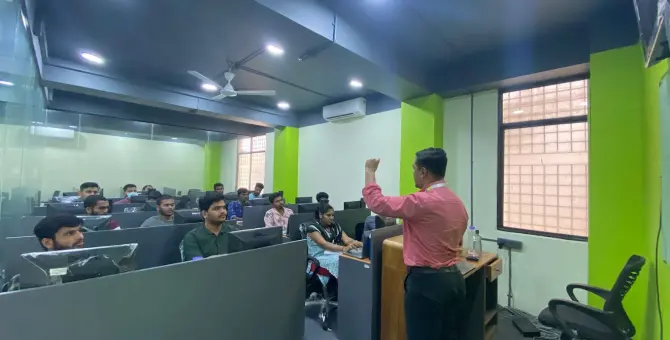
Classroom Training At Bangalore Branch
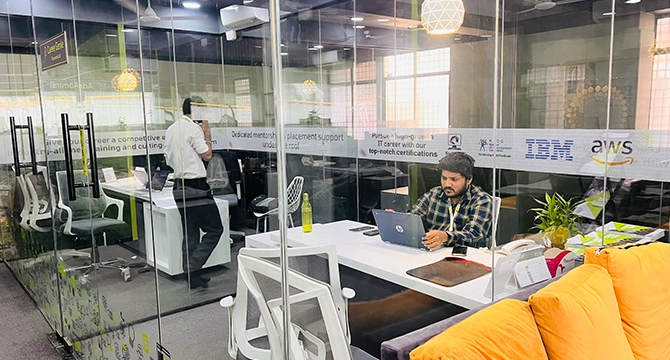
Career Guide Cabin At Bangalore Branch
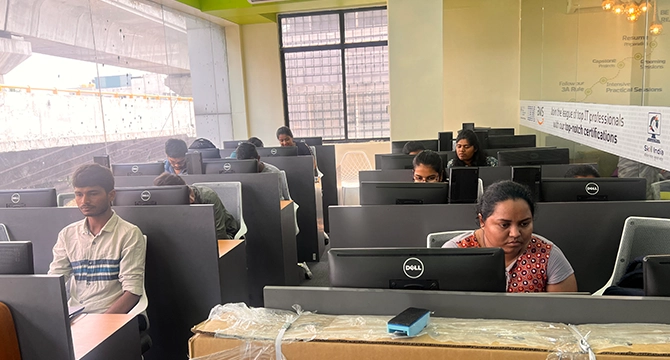
Classroom Training At Bangalore Branchh
Sit Out Area At Bangalore Branch
Address:
2nd Floor LKS Plaza, Old no.6, New no.129/3, A.C Block, 2nd Avenue, Anna Nagar, Chennai, Tamil Nadu 600040
 Get Directions
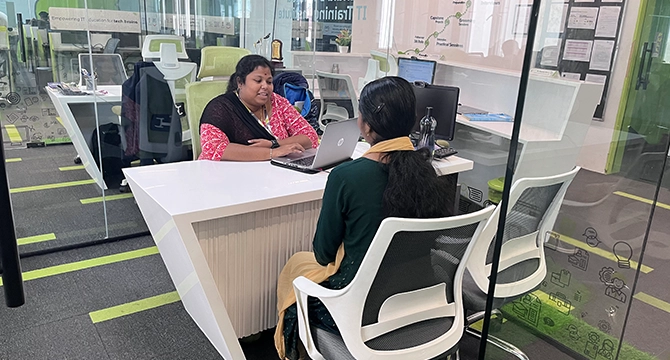
Career Guide Cabin At Annanagar Branch
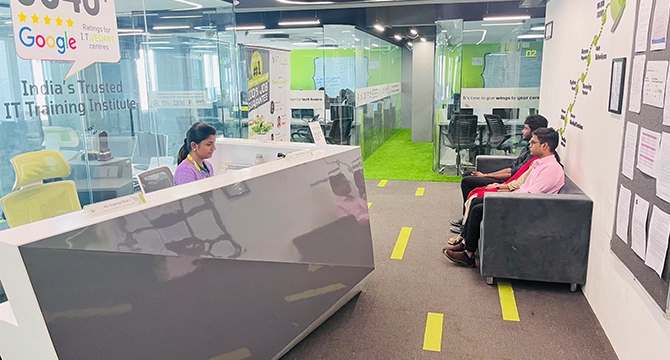
Reception Desk At Annanagar Branch
Sit-Out Area At Annanagar Branch
Classroom Training At Annanagar Branch
Classroom Training At Annanagar Branch
Address:
304, 3rd Floor, Fortune Signature, Above Pista House, Nizampet X Road, Kukatpally, Opp. JNTU Metro Station, Hyderabad, Telangana 500085
 Get Directions
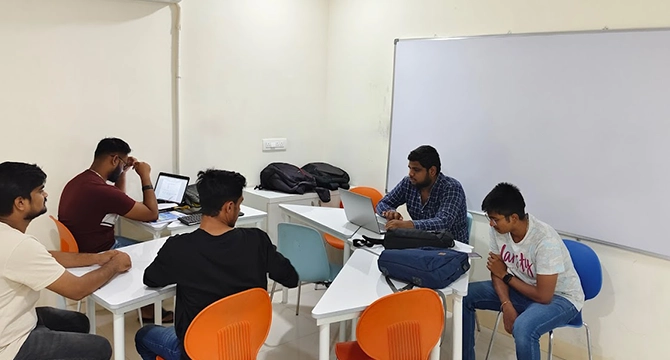
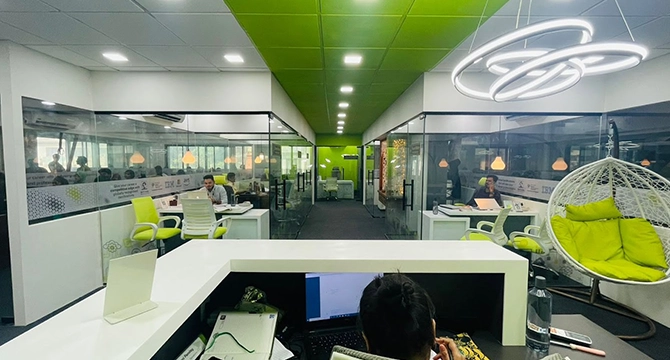
Sit-Out Area At Hyderabad Branch
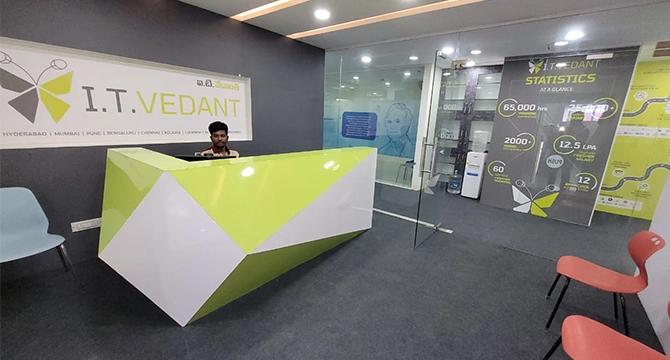
Reception Desk At Hyderabad Branch
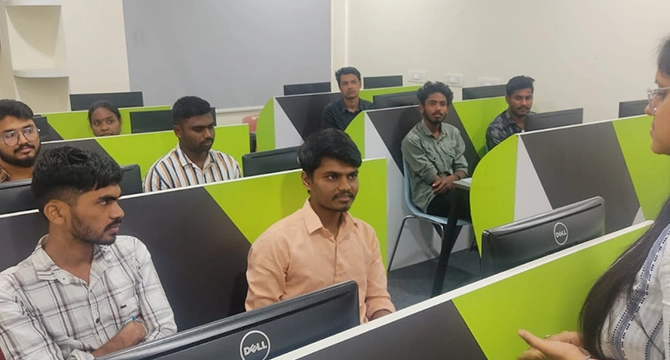
Classroom Training At Hyderabad Branch
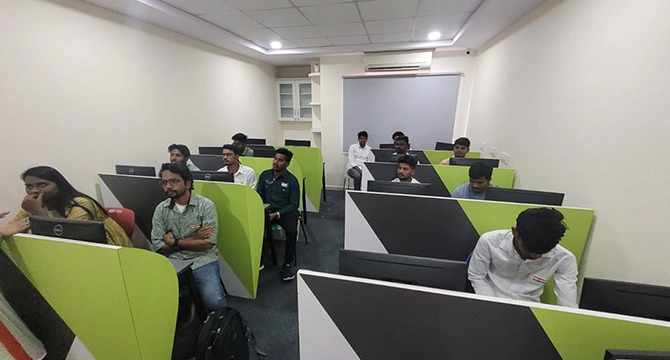
Classroom Training At Hyderabad Branch
Career Guide Cabin At Hyderabad Branch
Address:
1st Floor, Mohini Mansion, 1, Naval Kishore Rd, above Baby Hug Showroom, near Cathedral School, Hazratganj, Lucknow, Uttar Pradesh 226001
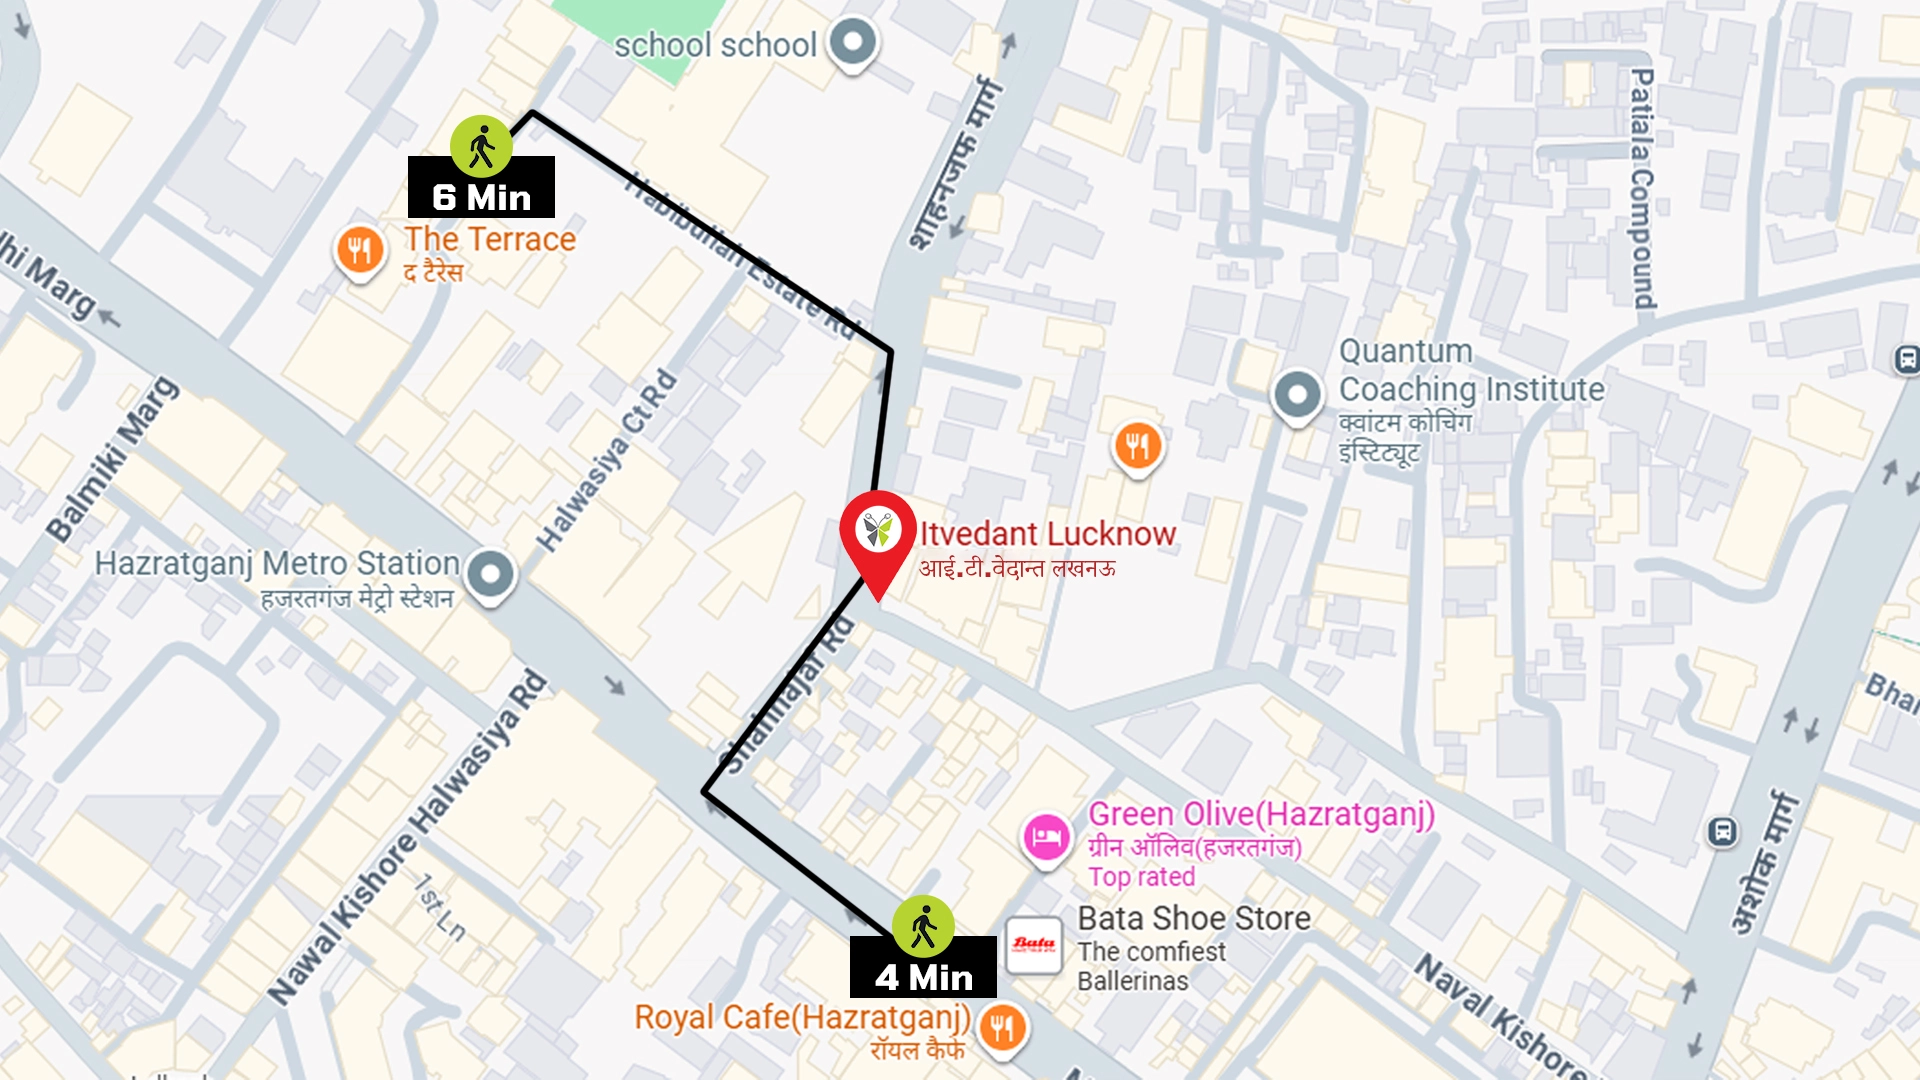 Get Directions
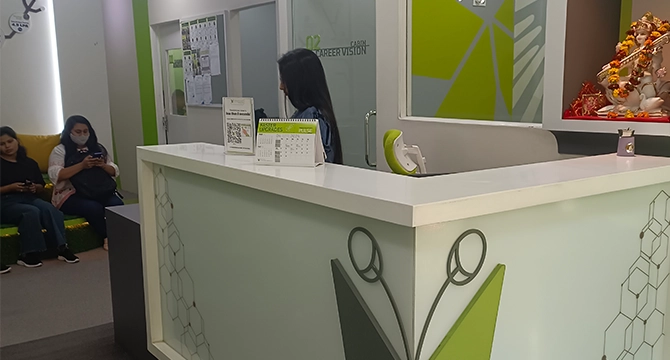
Reception Desk At Lucknow Branch

Sit Out Area At Lucknow Branch

Classroom Training At Lucknow Branch
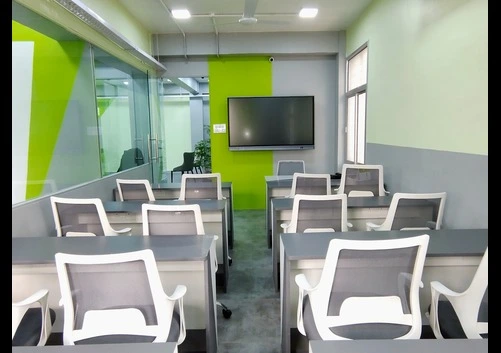
Classroom Training At Lucknow Branch

Interaction Session At Lucknow Branch
Address:
Itvedant, E-13, Second Floor, Beside Manav Medicare Center, South Extension Part-1, New Delhi - 110049
 Get Directions
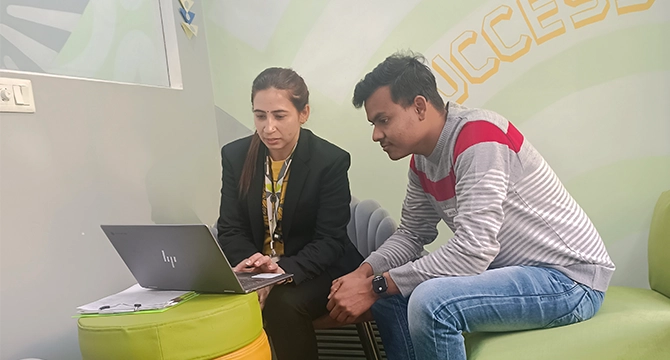
Career Guide Cabin At Delhi Branch
Reception Desk At Delhi Branch
Classroom Training At Delhi Branch
Sit Out Area At Delhi Branch
Classroom Training At Delhi Branch
Address:
303 /3rd floor, Iscon Avenue, Chimanlal Girdharlal Rd, Opp. Choice Restaurant, Above Kundanlal Jewellers, Navrangpura, Ahmedabad - 380009, Gujarat
 Get Directions
Reception Desk At Ahmedabad Branch
Interaction Session at Ahmedabad Branch
Sitout Area At Ahmedabad Branch
Sitout Area At Ahmedabad Branch

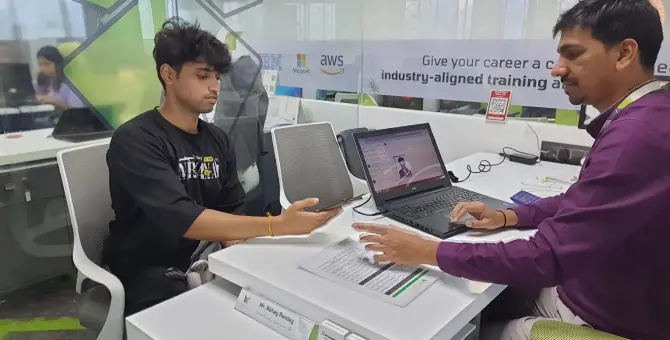
Personalised interaction with trainer
Address:
No: 18, 4th floor, Kerom building, MIDC, Road, next to State Bank of India, near Toyota Showroom, Wagle Industrial Estate, Thane, Maharashtra 400604
 Get Directions
Domain of Digital Education

With our experienced trainers!

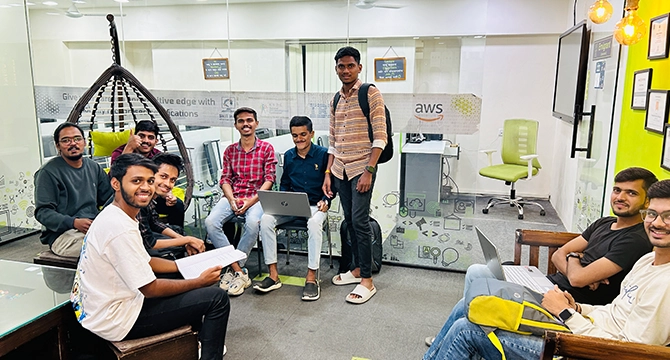
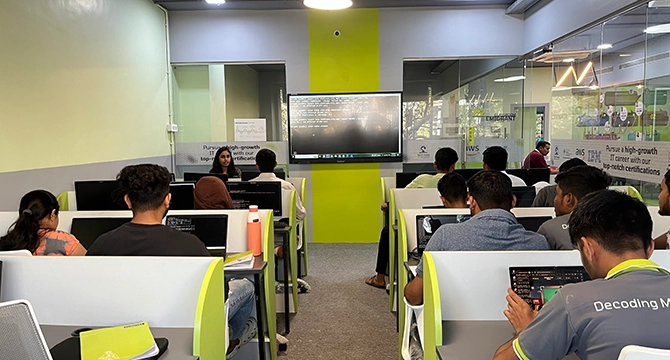
Experience immersive learning with Itvedant

Domain of Digital Education

Knowledge knows no boundaries


Individuals with a Bachelor's Degree or higher are eligible to enroll in our Python Full Stack Developer Course.
The duration of your course will be 8-10 Months but it solely depends on the number of modules you choose to learn.
The learner need not worry about missing a session as our dedicated Relationship manager will be ready to help them with anything related to administration. The Relationship Manager will arrange a session with professors if the learner misses a session.
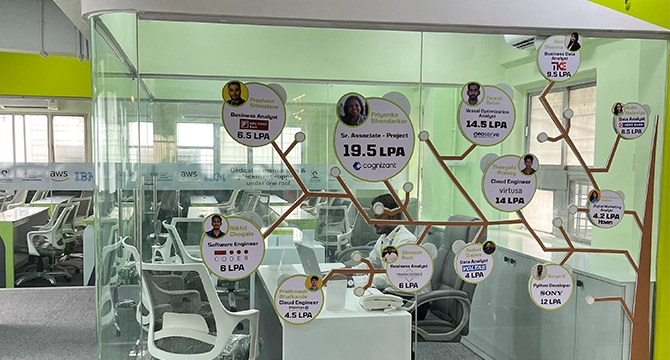
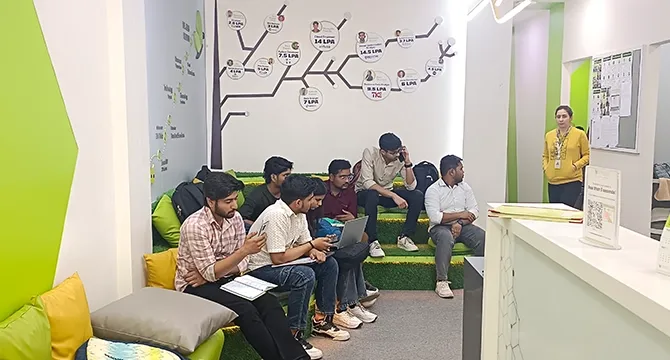
A fresher who’s completed their Python Full Stack Developer Course is most likely to draw a salary in the range of 2.4LPA - 12LPA.
As we have a very strong placement wing that makes sure that every learner gets placed, you will start receiving placement alerts in your learner portal right after enrolling in the course. We assure 100% Job Placement Assurance at Itvedant.
Post successful completion of the Python Full Stack Developer Course, a Masters's Certificate for the same will be granted from Itvedant along with IBM Certificate.
Yes, our unique modules help you become Industry-Ready right after the course completion and we also provide 100% placement Assurance.
You needn’t bring anything in particular for the Python Full Developer Course, you will be provided with individual desktops and study materials at Itvedant.
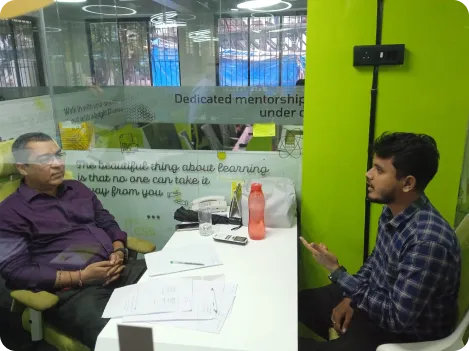
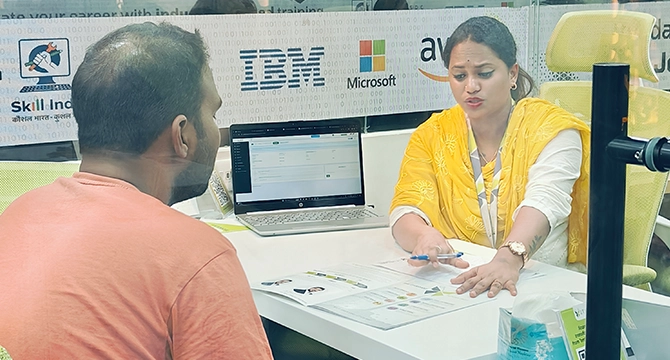
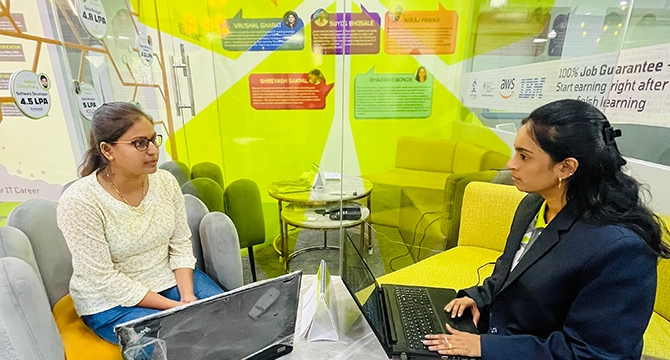
Our team of expert career guide ninjas are ready to help you choose the right path with clarity and confidence.

Data Science and Analytics with AI
![]() Duration : 8-10 Month
Duration : 8-10 Month
Python Full Stack Development
![]() Duration : 8-10 Month
Duration : 8-10 Month
Java Full Stack Development
![]() Duration : 8-10 Month
Duration : 8-10 Month
DevOps with AWS
![]() Course Duration : 6-8 Months
Course Duration : 6-8 Months
Digital Marketing with AI
![]() Duration : 8-10 Month
Duration : 8-10 Month
Investment Banking with AI
![]() Duration : 6-8 Month
Duration : 6-8 Month
Software Testing With AI
![]() Duration : 4-6 Month
Duration : 4-6 Month
Our Team will get in touch with you soon or call +919205004404 now to get answer for all your queries !
Our Team will get in touch with you soon or call +919205004404 now to get answer for all your queries !
Our Team will get in touch with you soon or call +919205004404 now to get answer for all your queries !
Our Team will get in touch with you soon or call +919205004404 now to get answer for all your queries !

 Download Career Report


 Talk to Career Guide